Platform Update: Noetic Query Builder, Trend Lines & Connectors
The Noetic Product and Engineering team has been working hard on recent updates to our core platform designed to simplify the user experience and deliver more immediate value for our customers. I will be at the RSA conference in San Francisco next week with other members of the team and am looking forward to sharing these updates with customers and partners, as well as hearing about innovation in our industry and will be available for in-person discussions there (more at the end of the update).
Some notable recent product highlights that I wanted to draw your attention to include:
The Next Evolution of Noetic Queries
Noetic’s Cyber Asset Graph empowers you to ask any question of your consolidated asset data, both at the “unified” level (e.g., a generalized “machine”) and using source-specific information (e.g., an AWS EC2 virtual machine instance settings).
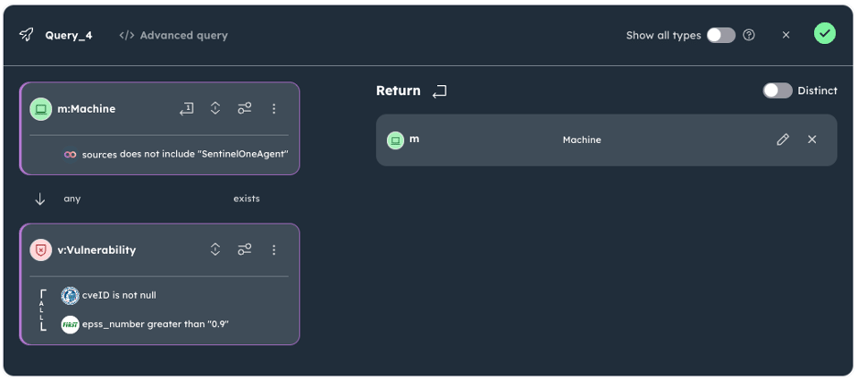
The Graphical Query Builder provides users with an alternative to the industry-standard Cypher language that we use to construct these queries. We have recently enhanced the Query Builder to expand the types of queries that can be created by allowing you to easily combine properties from both the unified and source-specific data maintained in the graph.
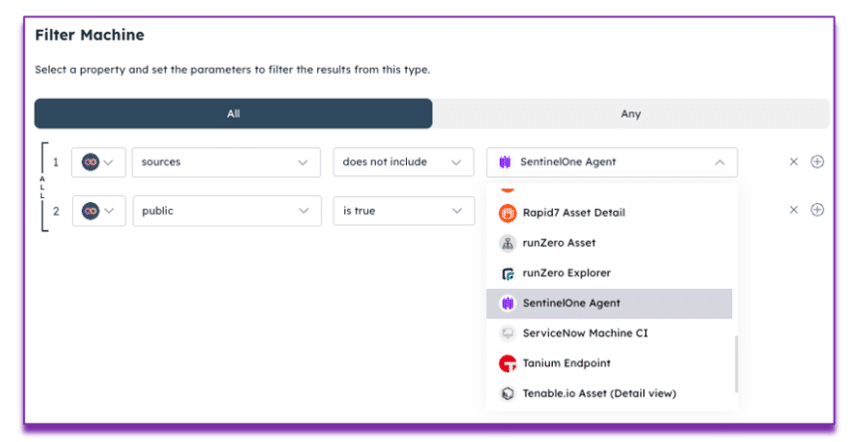
For example, users may need a list of all “machines” that do not have SentinelOne endpoint protection installed and that have exploitable vulnerabilities (via the CISA Known Exploited Vulnerabilities (KEV) Catalog) with a high likelihood of exploitation as defined by FIRST Exploit Prediction Scoring System (EPSS). This type of query, mixing elements of both our unified model and source-specific information, is easier than ever to create in the Query Builder.
Recent Query Result Enhancements
We continue to enhance the presentation of results from both custom queries and Noetic’s out-of-the-box library of queries. Recent updates include:
- Freezing the first column of the results tables, allowing you to scroll across a table without losing the important context that is usually found in the first column.
- Re-styling the results table to provide more content per page.
- Loading multiple pages of results into memory, allowing you to quickly browse through larger data sets.
Customers will continue to see enhancements to the query results tables over the coming months, including in-table filtering and sorting. Stay tuned for more updates on enhancements to query tables as they are released.
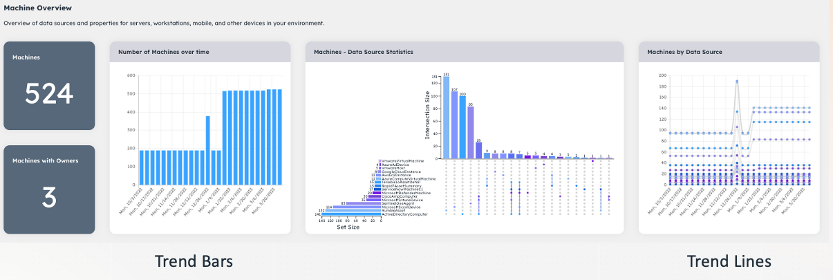
New Time Trending capabilities
Understanding trends of key asset and risk metrics is critical to effectively managing an IT or Cybersecurity team. We have recently released a preview of a “Trend Line” widget, empowering our customers to track metrics on daily, weekly, and monthly intervals. The Trend Line widget can be used with any query that returns numerical information (counts, a computed value, etc.). It allows security teams to track changes in any aspect of the Noetic graph (e.g., servers, workstations, cloud accounts, vulnerabilities, users, etc.). We expect to make the trending widget generally available shortly.
Simplified Enterprise Cloud Support
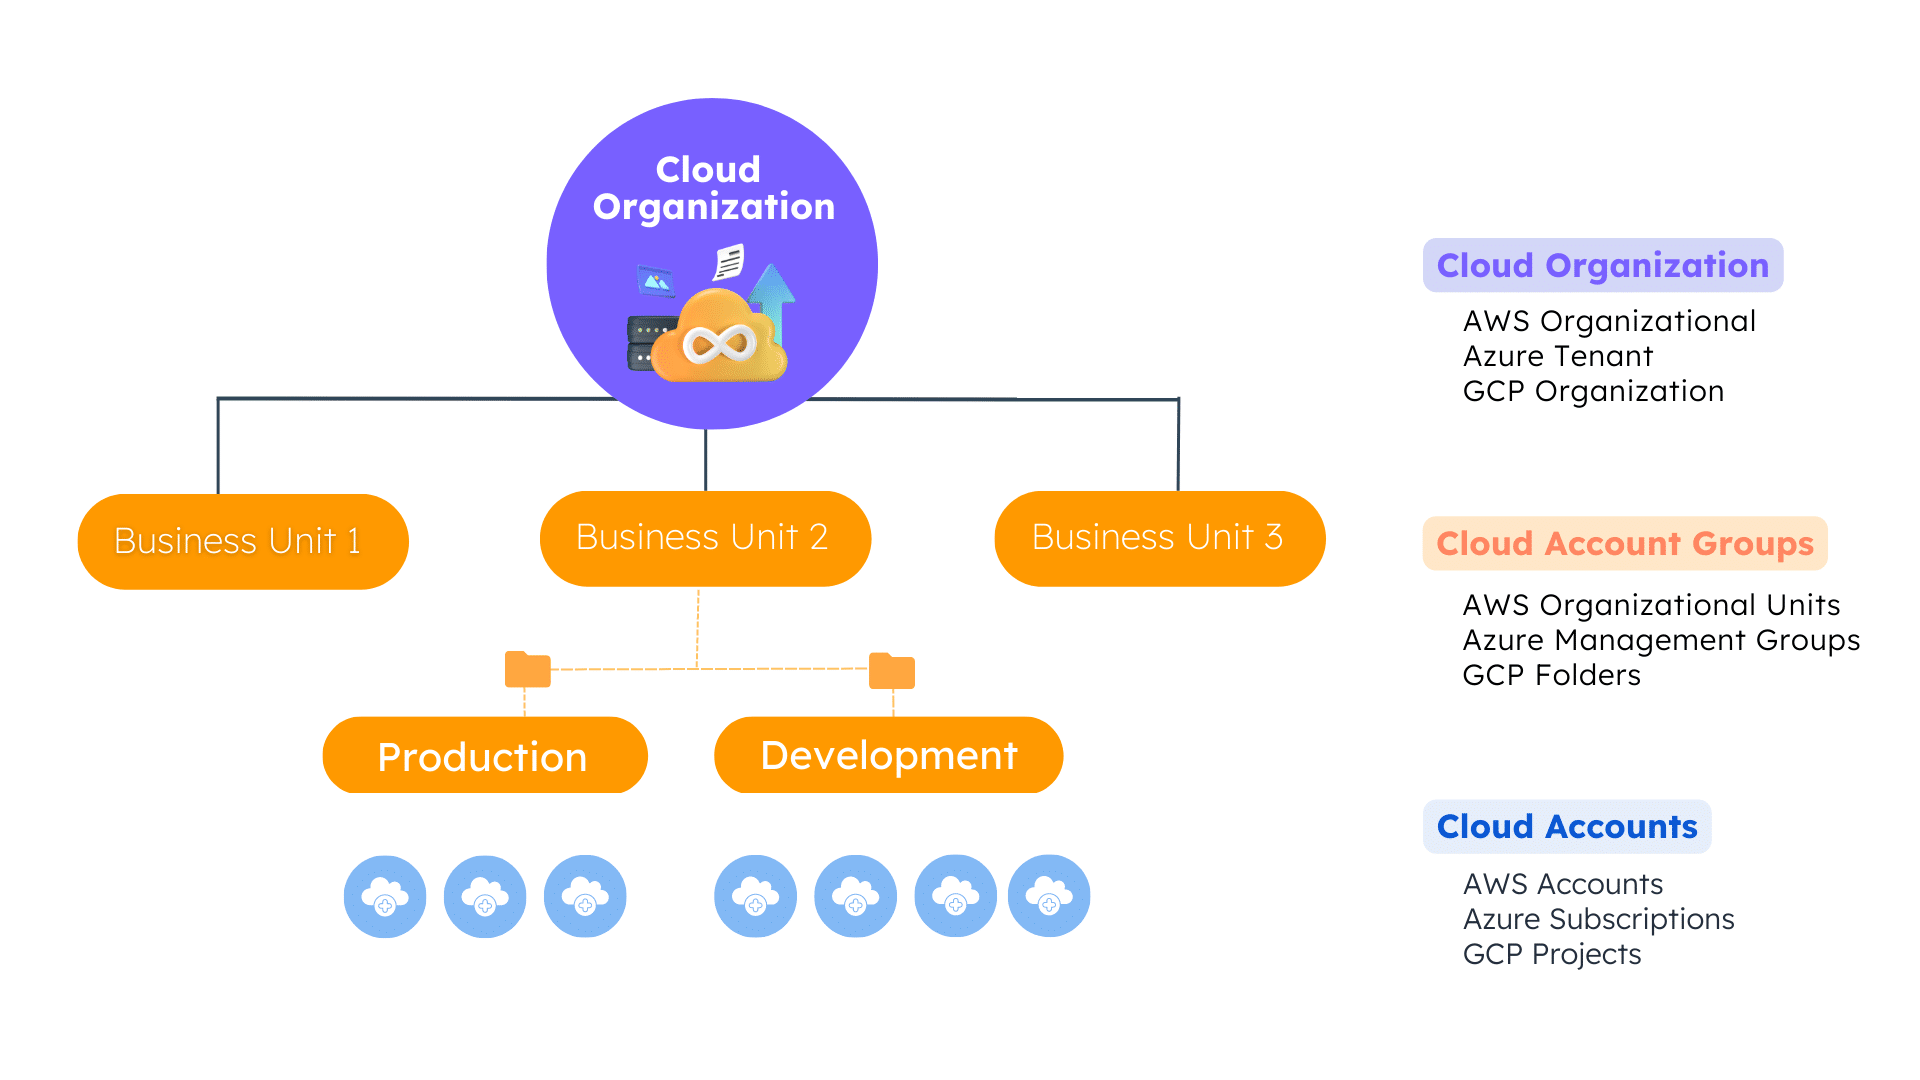
Anyone leveraging cloud providers such as AWS, Azure and Google Cloud Platform manages multiple “cloud accounts” (AWS accounts, Azure subscriptions and GCP projects), often reaching into 100’s of accounts. All three of these providers offer the ability to manage those accounts using a tree-like folder structure (e.g., AWS Organizations, Azure Management Groups, GCP Folders).
Our customers have shared that they often manage and report on posture and risk at the account or even “organization” level (e.g., all accounts associated with a business unit have specific security control requirements). We have expanded our Unified Model to include cloud accounts, account groups and organizations, allowing the Noetic Graph to represent cloud assets the way an organization does. We have also updated the Noetic connectors for AWS, Azure and GCP to capture this important organizational context of cloud data.
Easier Reporting through Widget Filters
The Noetic UI allows users to develop custom reporting dashboards by configuring graphical Widgets to chart the results of queries. In many cases, reporting on different attributes of a common asset type required the user to write and save multiple queries. We have streamlined the development of dashboards with the introduction of ‘Widget Filters’, which allow you to filter the results of a query as it is rendered in a widget.
For example, you might want to show Asset Type statistics only for systems which are running Windows. With Widget Filters, you can easily chart the Windows-only data without writing a Windows-specific query.
.png?upscale=true&width=858&upscale=true&name=MicrosoftTeams-image%20(53).png)
Connectors
Lastly, we continue to expand our data connectors, with recent additions including:
- BitSight: cyber risk analytics
- CarbonBlack Cloud: endpoint and workload protection
- CloudAware: CMDB features
- GitLab
- Netskope: edge security
- Qualys VMDR: vulnerability and risk management
- Remediant SecureONE: privileged account access management
- Snipe-IT: open-source asset management
The Noetic Connector architecture is also often used to incorporate custom enterprise application data (e.g., in-house CMDB’s) and to leverage organization-specific naming practices (e.g., DNS names) to add business context to the asset graph.
See you at this year’s RSA Conference!
Noetic will be exhibiting again at this year’s RSA Conference in San Francisco from April 24th to 27th. Our co-founders and technology leadership will be in town and the team will have a booth in the Early Stage Expo. Find out more about Noetic’s presence at next week’s show here.
About The Author(s)