May Platform Update: Interactive tables accelerate speed to insights
When we speak to our customers and partners about how they drive value from Noetic, what comes top of their priority list is making it simple and intuitive to deliver key insights from our powerful and flexible cyber asset and posture management platform.
Cyber asset attack surface management (CAASM) is an interesting security technology as it serves the needs of multiple stakeholders; Security Operations, Vulnerability Management, Governance Risk and Compliance (GRC), IT Operations and more all have a strong interest in understanding their cyber asset landscape, coverage gaps and key priorities from their own perspectives.
Today, we are announcing the availability of the first in a series of new features that we will deliver regularly throughout the rest of this year that empower our customers to easily answer common questions about their cyber assets.
Experience Rapid Time to Value with Interactive Tables
The heart of the Noetic Platform is our cyber asset graph, accessible to our customers via out-of-the-box queries, custom queries, and interactive graphical “widgets” in reporting dashboards. These queries and widgets present asset data back to different audiences that showcase security posture gaps, such as missing EDR agents or orphaned machines, configuration errors and unauthorized admin accounts. These continuously updated queries drive reporting and remediation through our automation engine.
Until now, to fine-tune the results of a query you needed to edit it, which required an understanding the Noetic data model using either our Graphical Query Builder, or the open source Cypher query language. With our new release, we provide you with interactive tables that allow you to easily filter and sort query results using controls in the column headers, providing new users with the ability to easily explore their asset data in their first minutes in the platform.
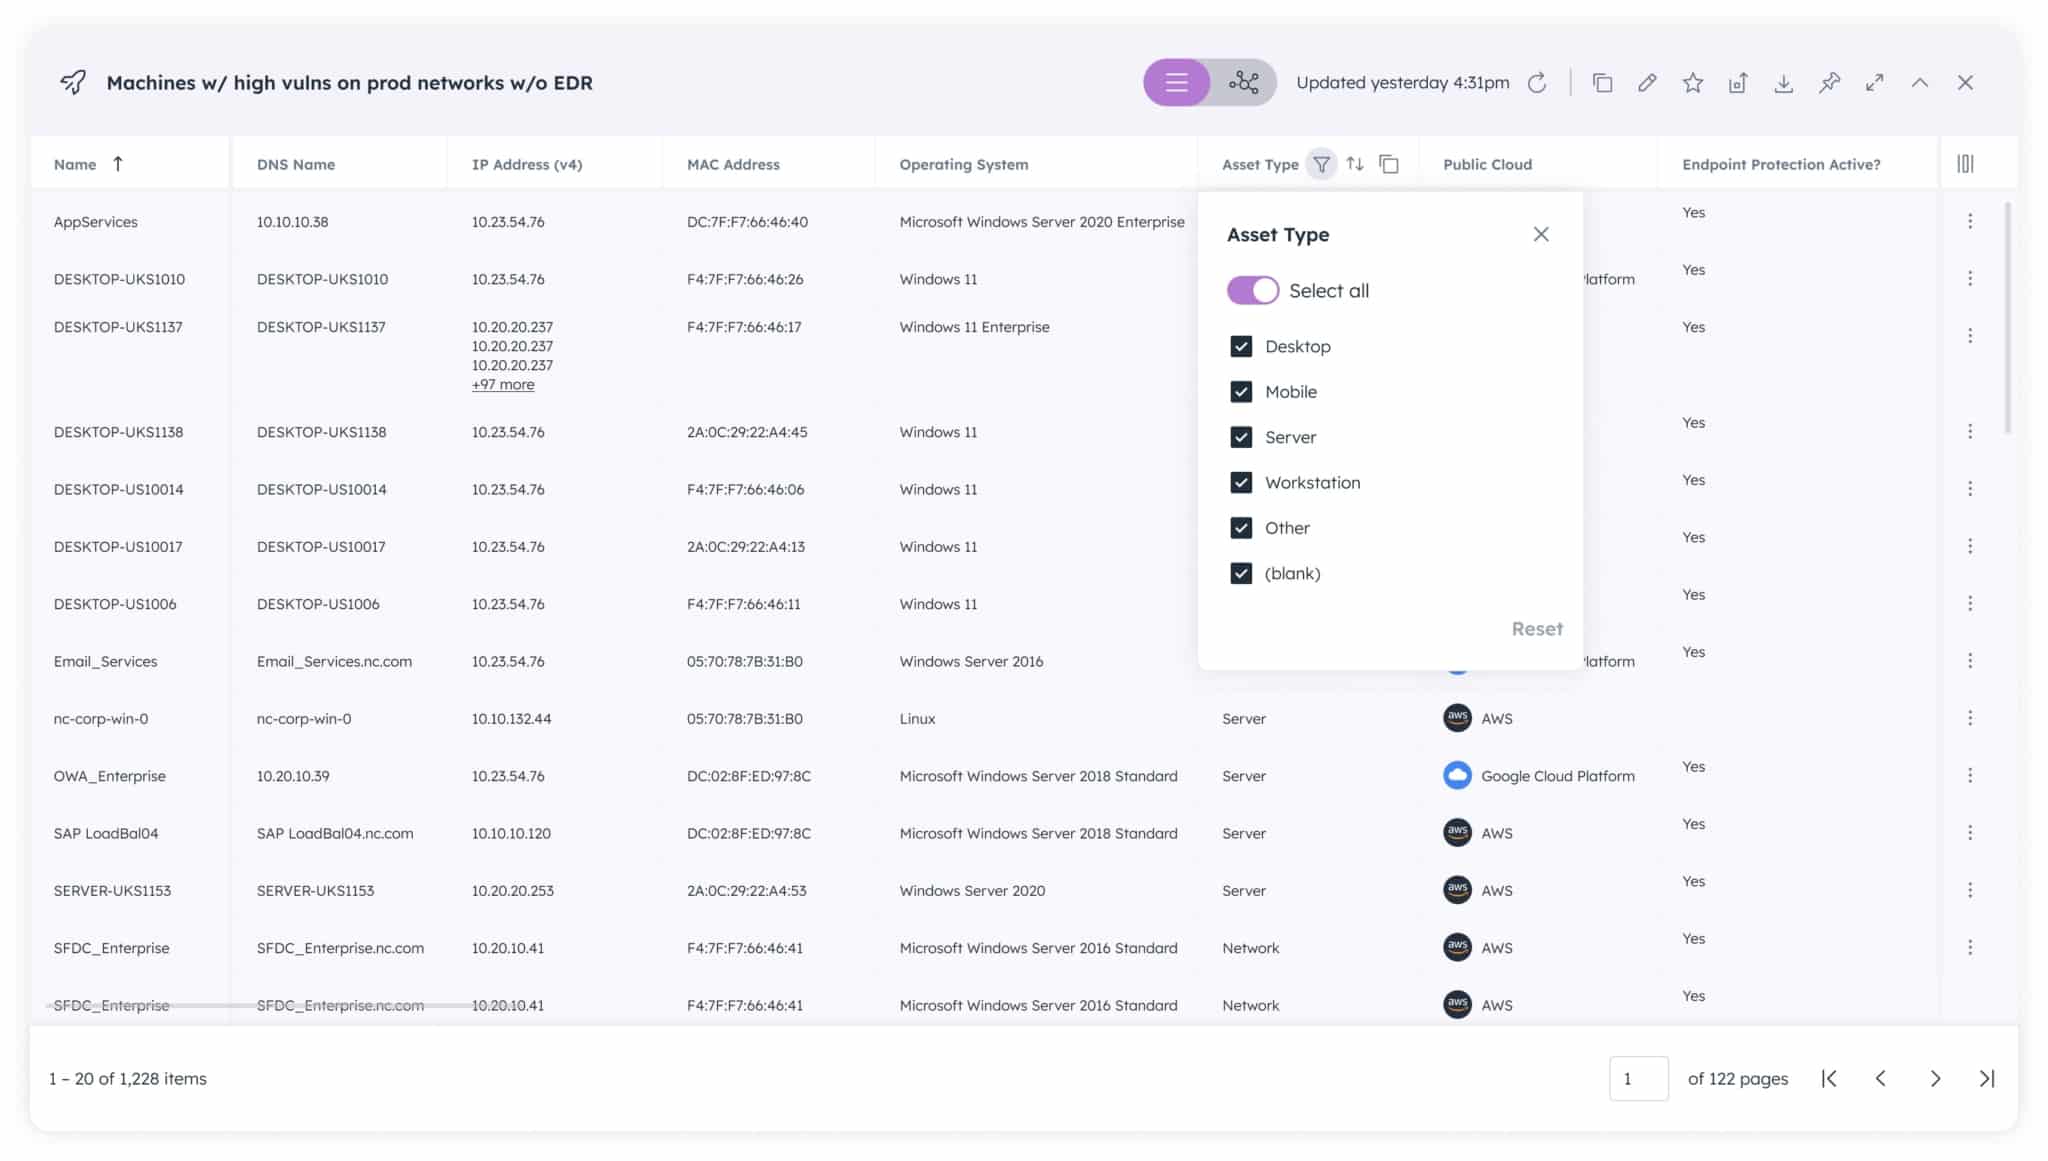
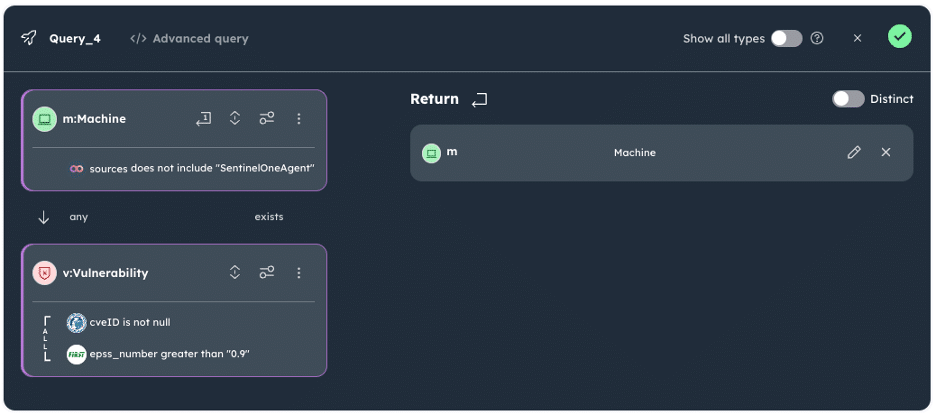
Furthermore, these filters can be quickly and easily saved as a new query, so they can be continuously updated and used as part of standard dashboards and reporting. This empowers you to continue to leverage the platform’s flexible reporting capabilities while also providing you with insight into the structure of the underlying Cypher queries created and modified via the interactive table.
Coverage Gap Analysis Made Easy
The new filtering capability also includes a specialized feature whenever a “sources” property is returned, enabling you to easily determine which assets do not come from one or more sources.
For example, if you want a list of all of the servers and workstations in your environment that don’t have the SentinelOne agent installed, you can filter your “Machines” list via a simple drop-down “Coverage gap by source” menu.
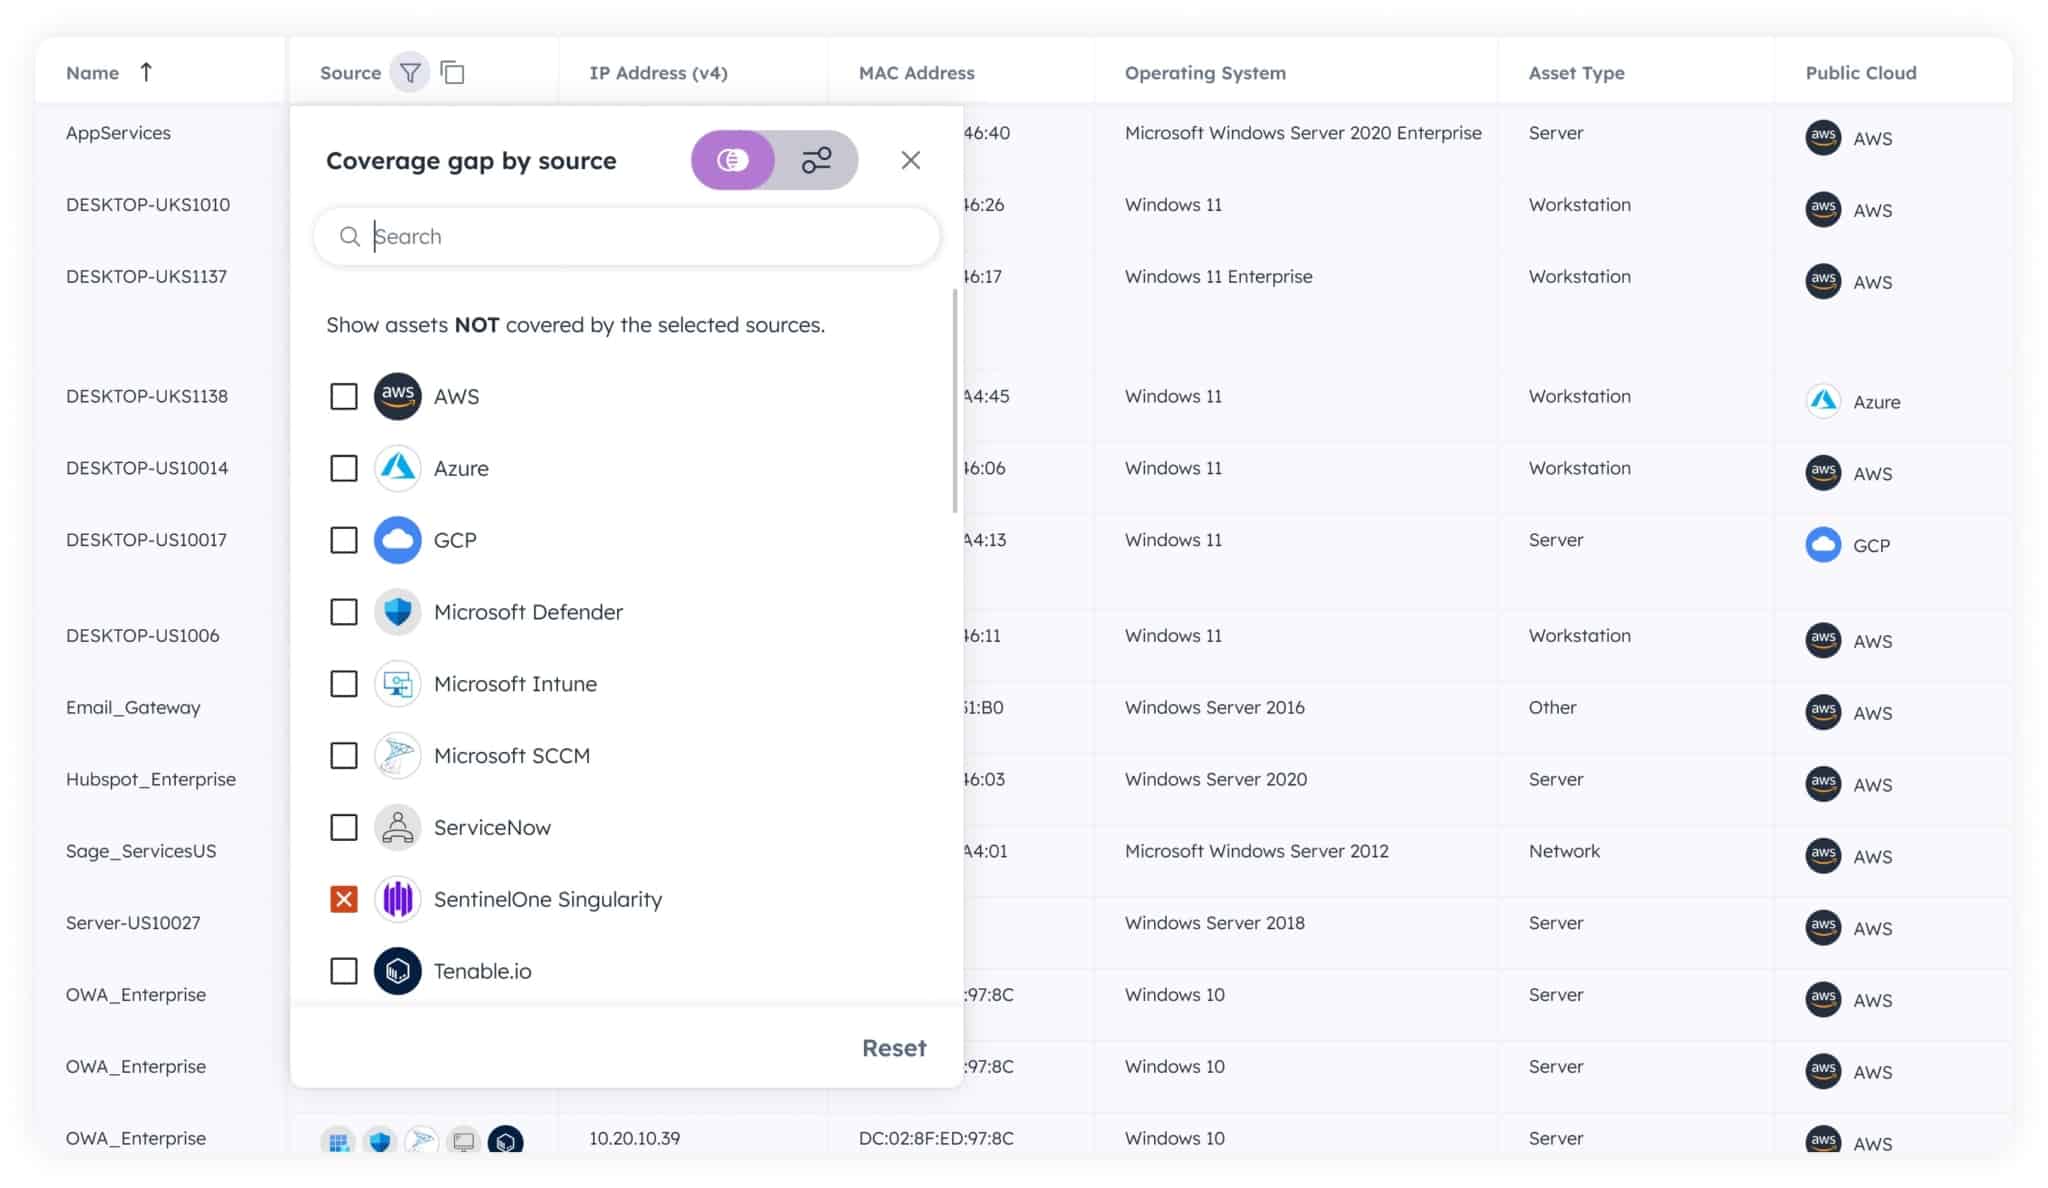
You can continue to refine this list by filtering on other columns in the table, such as operating system (OS), location and many more.
Simplifying the Power of Graph
Our goal with the new Interactive Tables, plus other upcoming features, is to make the incredible power of our core Cyber Asset Graph more consumable for new or occasional users of the Noetic platform. One of the key strengths of the Noetic platform is our ability to ingest data from multiple sources, correlating, aggregating and de-duplicating it to deliver unique insights into not only the security posture of your assets, but also the complex relationships between them. These multi-dimensional relationships are the real indicator of cyber risk as they help security teams to map technical cyber vulnerabilities with business criticality and exposure.
Graph database is an ideal technology approach for understanding and visualizing the attack surface, given the size and complexity of cybersecurity use cases, but the cyber industry’s current skillset in graph query languages is limited as it is early in the adoption cycle.
At Noetic we aim to simplify that adoption process for our customers. This new innovation complements the core asset graph query capabilities provided by both the industry-standard Cypher graph query language we use, and also by using our Query Builder, an intuitive graphical tool that guides you through the process of building cypher queries without having prior knowledge of cypher syntax.
By providing both an easy path to answering common questions and the ability to ask any question of our graph data, we believe that we can provide you with a platform that can evolve and meet your use cases as your security program evolves in the coming years.
To learn more about these new capabilities and get a better overall understanding of how the Noetic platform can help drive improvements in your security hygiene and posture management, join our upcoming live demonstration.
About The Author(s)